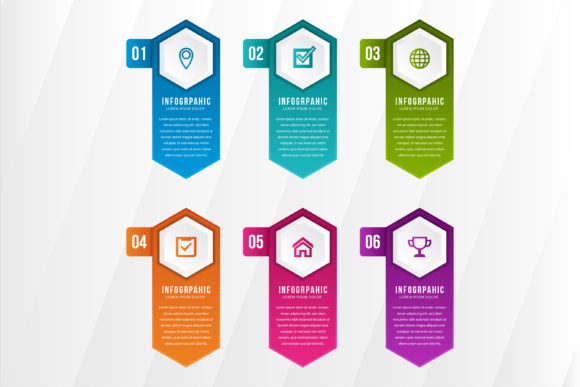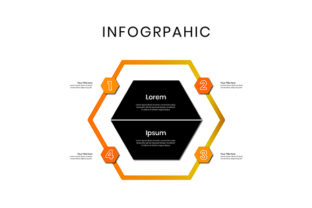
Hexagon Infographic: A Unique Visual Tool for Clear Data Presentation
Visual communication has become essential in today's information-rich environment, where clarity and engagement are key. Among the growing array of visual tools, the Hexagon Infographic stands out for its ability to convey complex relationships and comparisons in a structured yet visually appealing format. Unlike traditional charts or linear infographics, the hexagon layout allows for multidirectional connections, making it especially useful for illustrating interconnected concepts, strategies, or systems.
What Makes a Hexagon Infographic Unique?
The Hexagon Infographic is built around a six-sided geometric shape, with each side or segment capable of representing a distinct idea, data point, or category. This modular structure supports both symmetry and flexibility, allowing creators to link related elements in a non-linear fashion. The design is particularly effective for topics that involve multiple interdependent factors, such as business strategies, environmental systems, or multi-component processes.
What sets the Hexagon Infographic apart is its ability to balance visual interest with functional clarity. Each hexagon can serve as a standalone unit or connect to others, enabling a flow that mimics real-world relationships. This makes it a powerful choice for audiences seeking to understand how different components influence one another.
How Does It Compare to Other Infographic Formats?
Traditional infographics often follow a vertical or linear layout, which works well for storytelling or sequential data. However, these formats can become cluttered when trying to illustrate multiple interconnections. Circular or radial infographics offer a more holistic view, but they may sacrifice readability when too many elements are included.
In contrast, the Hexagon Infographic offers a middle ground: it maintains readability while supporting complex, multidimensional relationships. This makes it more versatile than linear formats when dealing with topics like stakeholder analysis, ecosystem modeling, or strategic planning where multiple variables interact.
- Linear Infographics: Best for step-by-step explanations or timelines, but limited in showing interdependencies.
- Circular Infographics: Good for cyclical processes or central themes with surrounding details, but may lack clarity in complex systems.
- Hexagon Infographics: Ideal for mapping relationships among six or more components, especially when visual symmetry and clarity are both important.
Strengths and Limitations of Hexagon Infographics
One of the main strengths of the Hexagon Infographic lies in its ability to organize information spatially without overwhelming the viewer. The geometric shape naturally guides the eye from one segment to the next, promoting a logical flow of ideas. This is especially useful when illustrating strategic frameworks, such as SWOT analysis, product ecosystems, or organizational structures.
However, this format isn't without its limitations. The fixed six-segment structure can be restrictive for topics that require more or fewer than six main points. Designers may also face challenges in maintaining visual consistency when combining multiple hexagons or integrating them into broader layouts. Additionally, audiences unfamiliar with this format might need a brief explanation to fully grasp the relationships being presented.
When to Use a Hexagon Infographic
The Hexagon Infographic shines in scenarios where multiple factors influence one another and where visual symmetry enhances comprehension. For example, a marketing team might use it to show how different channels contribute to a campaign’s success, or a sustainability report might employ it to depict how economic, social, and environmental factors interconnect.
It's particularly effective when:
- Presenting a system or model with six key components
- Illustrating how elements within a framework influence each other
- Creating a visually balanced layout that supports both detail and overview
However, if your content doesn't naturally fit into a six-part structure or if the relationships are primarily linear or hierarchical, other formats may be more appropriate.
Practical Examples and Use Cases
Let’s look at a few real-world applications where the Hexagon Infographic proves especially valuable:
- Business Strategy: Mapping the six pillars of a company’s strategic plan—vision, market position, customer engagement, operations, innovation, and financial health—within a single hexagon helps stakeholders see how each area supports the others.
- Education: In curriculum design, a hexagon infographic can show how core subjects, soft skills, assessment methods, technology tools, teacher support, and student engagement interrelate.
- Healthcare: A public health campaign might use a hexagon to connect factors like nutrition, physical activity, mental health, preventive care, community support, and policy changes.
In each case, the structure supports a clear, interconnected view that would be harder to convey using a linear or segmented format.
Choosing the Right Format for Your Message
When deciding whether to use a Hexagon Infographic, consider both the nature of your content and the expectations of your audience. If your goal is to highlight balance, interdependence, or multidirectional influence, this format can be a powerful ally. However, if your message is linear, hierarchical, or involves a very large number of components, you may want to explore alternatives like flowcharts, tree diagrams, or layered pyramids.
Another consideration is design flexibility. The Hexagon Infographic works best when integrated into a clean, uncluttered layout. If you're combining it with other graphic elements, ensure that the overall design supports readability and doesn't distract from the main message.
Technical Considerations: Working with EPS10 Files
The Hexagon Infographic is often delivered in EPS10 format, a vector-based file type that offers scalability without loss of quality. This makes it ideal for both print and digital use, especially when high-resolution output is required. Designers can edit EPS files using software like Adobe Illustrator, making it easy to customize colors, labels, and connections to fit specific branding or messaging needs.
However, EPS files may not be as universally accessible as other formats like PNG or JPEG. Users without vector editing tools may need to convert the file for certain applications. If your audience includes non-designers or you're working within a content management system that doesn’t support EPS, consider exporting the infographic into a more widely compatible format while retaining the original for future edits.
Final Thoughts on Hexagon Infographics
The Hexagon Infographic offers a compelling way to present complex, interconnected data in a structured and visually engaging manner. Its strength lies in its ability to balance clarity with creativity, making it a valuable tool for professionals across industries. However, like any visual format, it works best when used intentionally and in alignment with the message and audience needs.
Whether you're building a strategic presentation, designing educational materials, or crafting a data-driven report, the Hexagon Infographic can help you communicate more effectively—if it fits your content and goals. When it doesn’t, exploring alternative formats ensures your message remains clear, relevant, and impactful.